 Instagram can be a florist’s best friend. Our industry’s products are quite literally born to be shared and can create an instant emotional connection at first gaze. Leveraging a visual medium such as Instagram to spread the joy and beauty of flowers could have limitless benefits for flower brands everywhere.
If you really want to use Instagram like a pro though, you need to understand who your content is reaching, how your content is reaching them and what your audience is doing once they see your content. Lucky for you, Instagram’s native Insights tool can give you more than enough information to analyze and optimize your Instagram strategy.
Before we get too deep with Instagram Insights, the first thing we need to do is make sure that we are managing a business account. Business accounts have access to several tools that personal accounts do not, one of them being the powerful Insights tool.
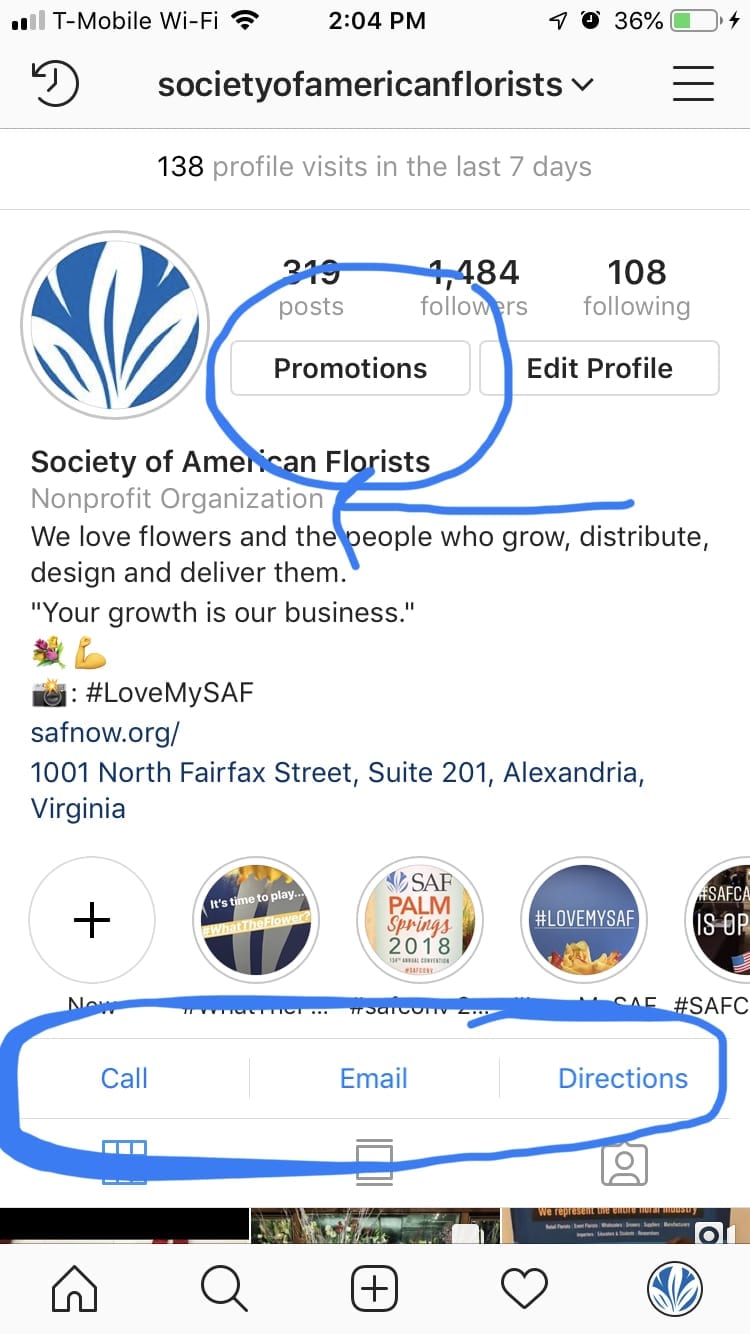
If you’re not sure which type of account you have, the easiest way to check is by looking at your profile within the Instagram app. Business accounts will have several features that a personal account does not, like business type listed below your name, promotions tab to track your paid ads and call-to-action buttons to aid the customer experience. We use the Call, Email and Directions buttons, which can be customized by tapping the Edit Profile button and editing the Contact Information section.
If you’ve confirmed that you operate a personal account and you’d like to switch over to a business account (which you should), you can follow these instructions.
The most powerful tool that business accounts have access to, in my opinion, is the Insights tool. Insights is Instagram’s packaged analytics tool that can be used to track lots of key data points including general reach, impressions and engagement, as well as more analytical data including audience analysis and content type performance. Best of all, Insights is totally free.
You can find the Insights tool by visiting your profile, tapping the menu in the upper righthand corner and then tapping Insights. It should be the first menu item.
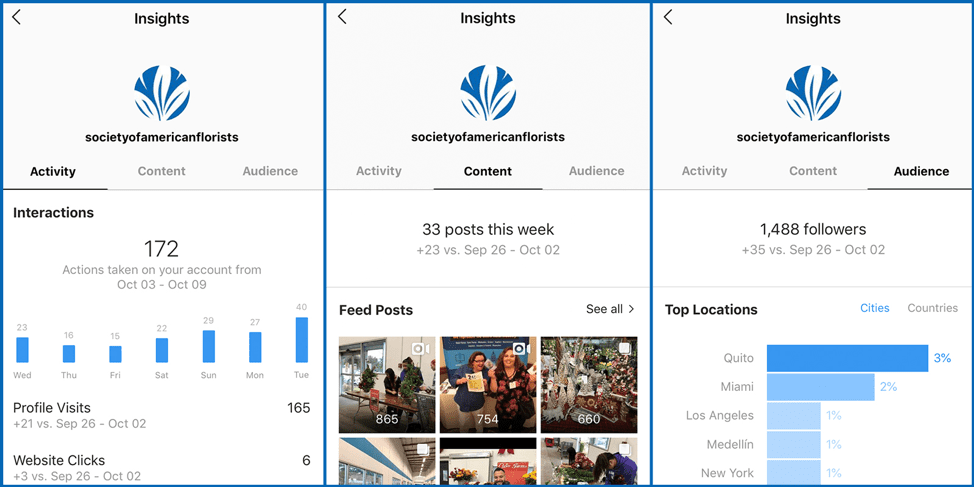
Once you’ve accessed the Insights dashboard, you’ll see three main tabs: Activity, Content and Audience.
The Activity tab should load first by default, so we’ll start there.
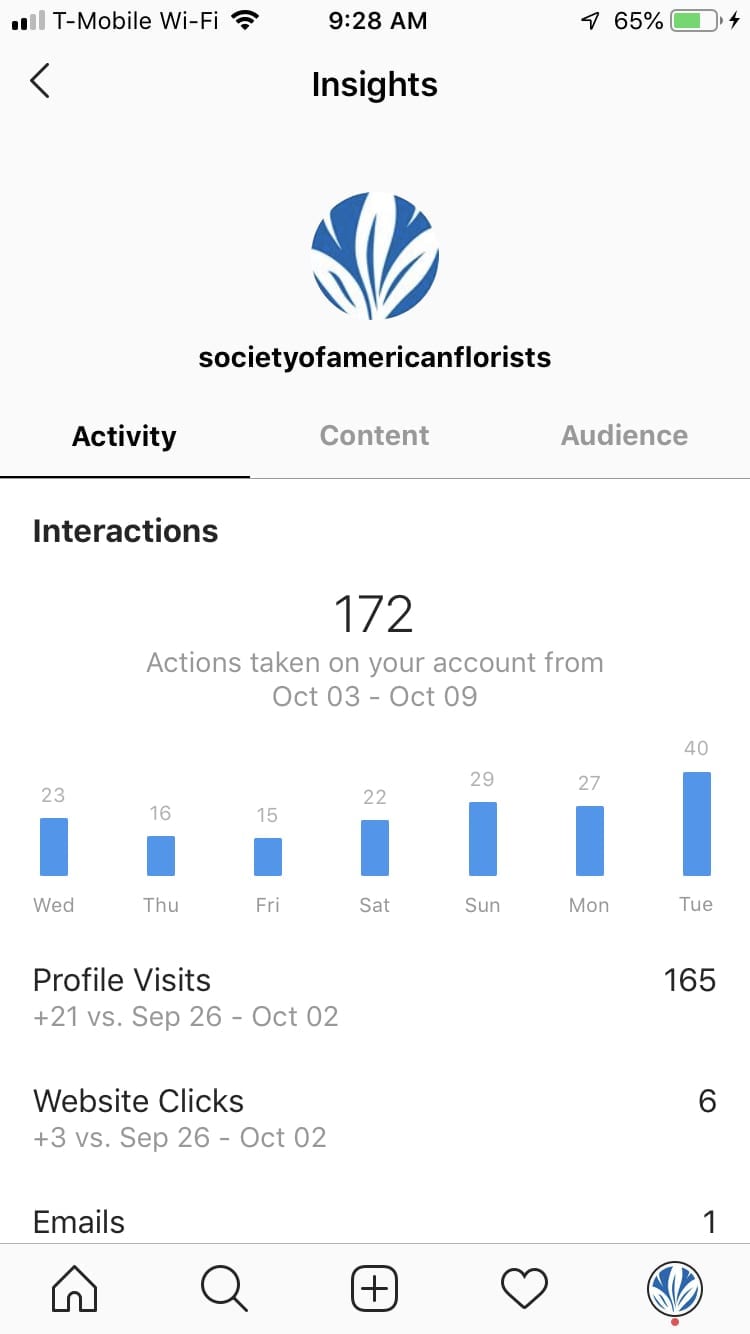
Activity shows you a snapshot of profile engagement (Interactions) as well as content visibility (Discovery) within the last week. Use the Activity tab to track how many users your content is finding and how many actions users have taken on your profile as a result. Remember those call-to-action buttons that business accounts have access to? You’ll see any corresponding activity listed under Interactions.
A quick word on reach vs. impressions. The Discovery section provides a day-by-day look at how many users have seen your content, as seen in the blue graph. This graph represents Reach data, which is the unique number of profiles that have viewed your content over the last seven days. Below the graph you’ll see the same data, but you’ll also see Impressions. The key difference between Reach and Impressions is that Reach is a unique data point that represents people, whereas Impressions tells you how many views your content has gotten.
I would recommend tracking this data in a spreadsheet on a weekly basis, then aggregating it into a monthly report to see how your content is generating brand engagement over time. Also, if you’re making any big announcements or make any tweaks to your strategy, take note of these dates and see how your data responds as a result. How are you going to know if your optimizations pay off if you don’t keep track of them?
Moving on to the Content tab which is broken down into three sections: Feed Posts, Stories and Promotions. The Content tab is used to see which posts are performing the best and is very important in defining your posting strategy.
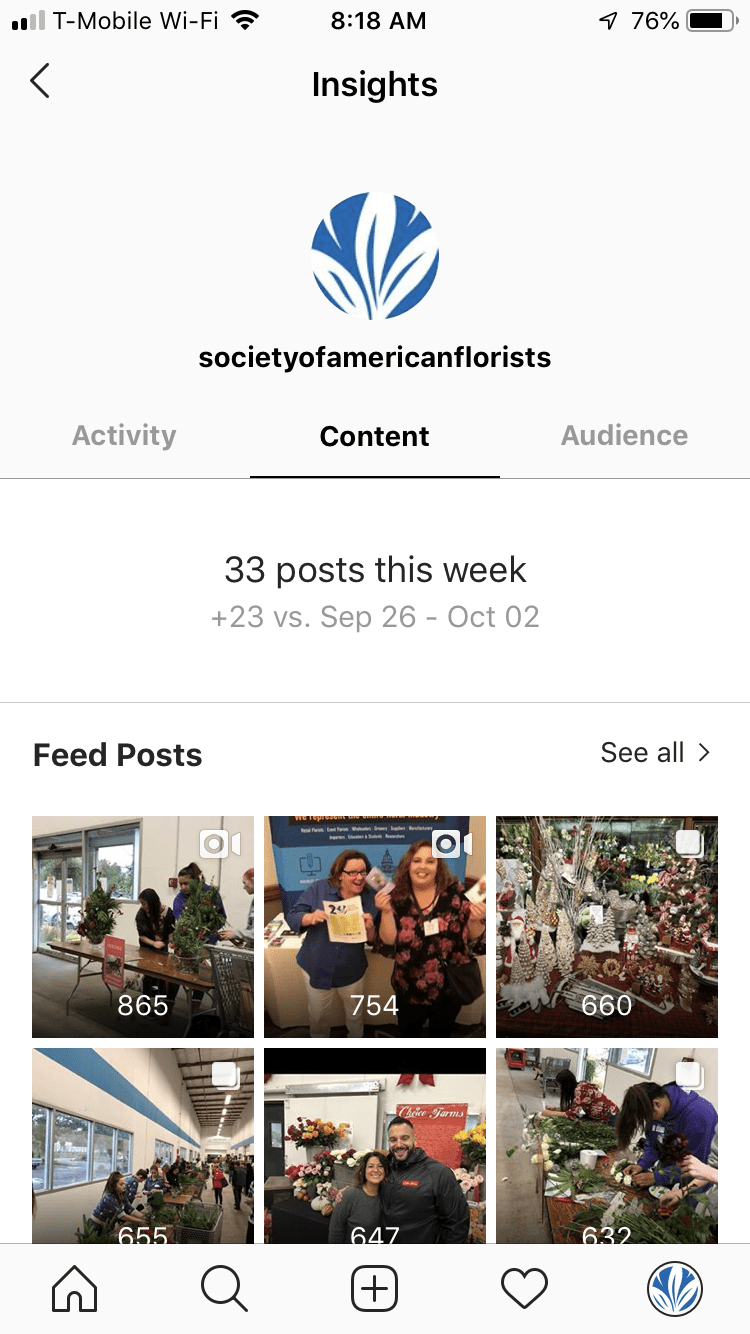
As a first step, tap “See all” in the Feed Posts section. This opens up an expanded look at your posts and gives you the ability to filter your posts by post type, metrics and timeframe to see what kind of engagements your content is generating within a specified timeframe. Tap the top of the window to choose your filters and then hit “Apply”.
Here are a few filters that I use, labeled by the pattern or goal I’m looking to measure:
- Follower Growth: All // Follows // 30 days. See which posts generated the most new followers to your account. This is handy when experimenting with a new tagging strategy that can get new eyes on your content.
- Algorithm Response: Photos/Videos // Impressions // three months. If you want to see how the algorithm is responding to your posting strategy, filter your posts by photos and videos and check the impressions over a three-month span. Which content type is getting the most eyes? Is using video really improving the frequency in which your content is seen?
- Web Traffic: All // Website Clicks // 30 days. We should always be interested in how our content is leading people to back to our website. Track this monthly to see which posts are driving the most elevated interest to your brand.
There is so much that you can do with these filters, so I’d recommend just playing around with them to see which filters work best for you and your goals.
If I could make one recommendation, it would be to track engagement by post type on a weekly and monthly basis. This will help you gauge how your audience is responding to your content and see which posts are doing better than others. See what kind of content is really moving the needle and post more of it. If you’re experimenting with new types of content, track it using these filters and see if it’s something you want to include in your posting strategy.
The final Insights tab to explore is the Audience tab. This tab shows you who is seeing your content. Demographic info like location, age range and gender should give you a better understanding of your audience. Use this data to help craft your messaging to appeal to the greatest segment of your audience.
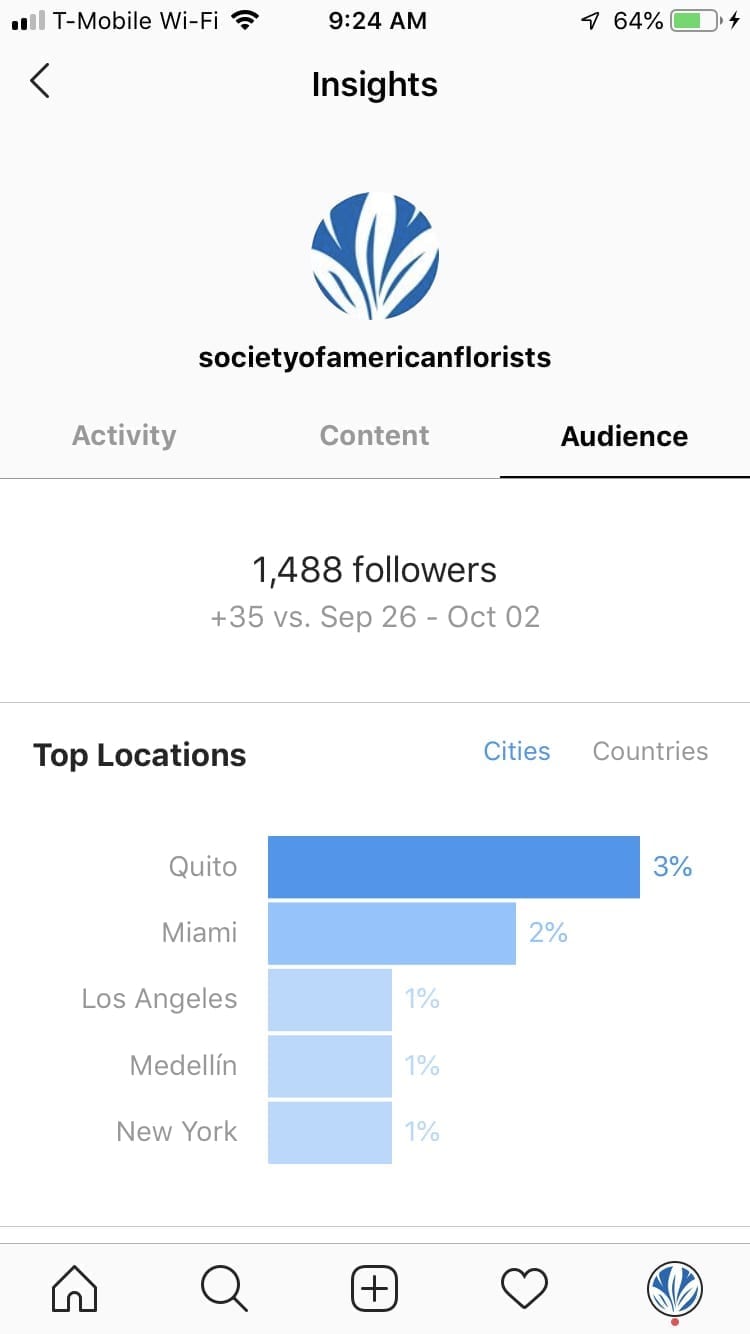 Does your audience skew younger? Load up on emojis and keep your meme game strong. Pop culture references are also key. Have a lot of international traffic? Maybe consider simpler messaging to account for any language or accessibility barriers. If you’re a local business, check up on which cities are viewing the most of your content and then make sure your content is loaded up with local flavor.
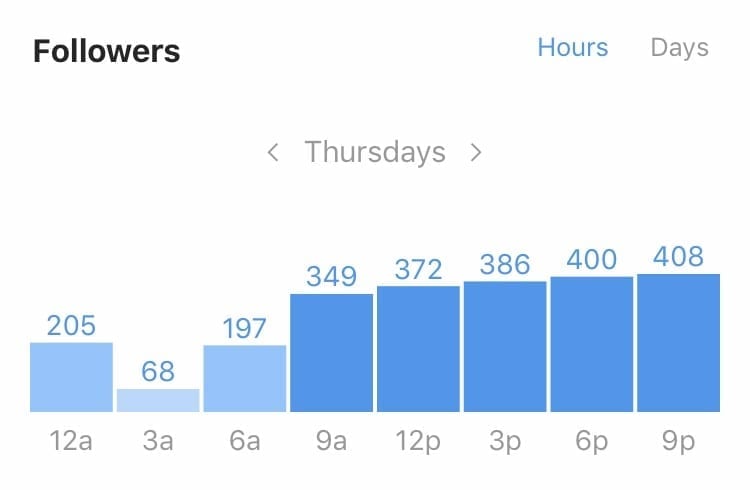
There is one very important tool within the Audience tab that every brand needs to be aware of, and that’s the Followers section.
This section shows you which days and hours during each day that your followers are most active on Instagram. This is important to know because the Instagram algorithm values quick and timely engagement when determining the overall value of your content. Try to post when your followers are most active in order to attract the most organic engagement, which will boost the value of your content and improve its visibility. Judging by our data, for example, it looks like our followers are most active on Thursdays between the hours of 9 p.m. and 12 a.m. Hello, night owls.

Hopefully, by now you have a better understanding of just how powerful Instagram’s Insights tool is and how you can use it to optimize and analyze your posting strategy. To reiterate, Instagram can be an incredibly powerful tool for florists to market their products to an interested audience, but Insights can show you just how well you’re using and help you use it better.
Have a question about social media or digital marketing? SAF is here to help. Email mduchaine@safnow.org.
Max Duchaine is the digital strategy manager for the Society of American Florists.