Source: SAF 2015 Holiday Sales and 2016 Valentine’s Intentions Survey. Emailed Jan. 4. 8.7 percent response rate.
More than half of florists say 2015 December holiday sales were higher than 2014 returns.
Among the 54 percent who saw an uptick, the increase was modest but noticeable. Thirty percent of respondents to a Society of American Florists (SAF) post-holiday survey said they experienced an increase between 1 and 5 percent. Twenty-two percent of respondents said the increase was between 6 and 10 percent and 10 percent classified it as between 11 and 15 percent.
Here’s an in-depth look at some of the returns from SAF’s December Holidays survey. See “February 14: Tempered Expectations” for the industry’s take on the prospects for the 2016 holiday, which falls on a Sunday.
December Holidays: Mostly Jolly
While 54 percent of overall respondents reported an increase in December holiday sales, the rosy results weren’t universal. A quarter of respondents reported a decrease and 20 percent said sales were flat.
Some variation seems to exist depending on business size:
- Businesses with less than $300,000 in annual sales: 54 percent saw an increase, 29 percent saw a decrease and 15 percent saw flat sales.
- $300,000 to $499,999 in annual sales: 53 percent saw an increase, 24 percent saw flat sales and 24 percent saw a drop.
- $500,000 to $999,999 in annual sales: 53 percent saw an increase, a quarter saw flat sales and 23 percent saw a decrease.
- $1 million-plus in annual sales: 63 percent saw an increase, 23 percent saw a drop and 13 percent said sales were flat.
The location of each business also affected responses: 56 percent of self-described urban shops saw an increase in sales, which was about on par with the 57 percent of suburban shops who noted similar positive results. Meanwhile, 52 percent of small town shops and 50 percent of rural shops reported an increase.

Source: SAF 2015 Holiday Sales and 2016 Valentine’s Intentions Survey. Emailed Jan. 4. 8.7 percent response rate.
Factors Behind Increases
Those who saw an increase credited the weather (29 percent); higher price points (28 percent); regional economies (26 percent); fewer competing flower shops (25 percent); increased shop promotions (18 percent); more event/party work (18 percent); more corporate business (15 percent); expanded territory or new location (11 percent) and higher delivery charges (6 percent), among other factors.
About half of respondents who saw an increase saw a rise in phone sales; 49 percent saw an uptick in website orders and 44 percent saw gains in walk-in sales. Meanwhile, 22 percent saw increased wire-in orders and 18 percent saw improvement in giftware sales. 11 percent saw increases in wire-out orders.
Reasons for Drop-Offs
Among those who saw a drop in sales, 56 percent said they weren’t sure by how much sales tapered off, and 17 percent said the decrease was between 1 and 5 percent; 14 percent classified it as 6 to 10 percent and about 13 percent said it was 11 percent or higher.
Respondents who saw decreased sales blamed a lack of corporate business (23 percent); regional economies (21 percent); competition from order-gatherers (20 percent); less party and event work (19 percent) competition from non-floral vendors (18 percent) and mass marketers and supermarkets (14 percent); unfavorable weather (14 percent); and lower price points (5 percent). Only 5 percent listed competition from other florists or street vendors as a factor.
42 percent of respondents who saw a drop-off said wire-in sales decreased; 35 percent said wire-out orders declined and 31 percent said phone orders were down. About 27 percent said walk-in sales dropped and 21 percent said website sales declined. Roughly 17 percent said giftware sales were down.

Source: SAF 2015 Holiday Sales and 2016 Valentine’s Intentions Survey. Emailed Jan. 4. 8.7 percent response rate.
The Big Push: Promotions and Outreach
Among all respondents, the following mediums proved popular ways to promote the December holidays: social media (80 percent); store signage (67 percent); online ads (62 percent); email promos (55 percent); print ads (49 percent); direct mail (34 percent); radio ads (24 percent); outdoor ads (22 percent); PR/media interviews (8 percent); and TV ads (6 percent).
In write-in responses, several respondents credited strong visual merchandising, in the form of stand-out window displays, signage and outdoor lights.
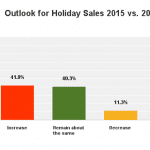
Compared to last year, 56 percent of respondents said promotions stayed about the same. About 36 percent said they increased their efforts and 5 percent scaled back.
Sales Breakdown
The average sale for the holiday, according to all respondents, was about $67.
About 26 percent of respondents said 6 to 10 percent of holiday sales came through their website. Another 20 percent said 11 to 15 percent of sales came through the site; 19 percent placed the number at 1 to 5 percent; 14 percent said 21 percent or more and 11 percent said it was 16 to 20 percent.
Fifty-three percent of respondents did not offer holiday décor services. Among those who did, 54 percent said the segment stayed the same and 31 percent saw an increase. Fifteen percent said their décor business dropped.
Only 39 percent of respondents held a holiday themed open house in 2015. About half of respondents ran an after Christmas sale. (According to write-in sales, the vast majority of these sales involved slashed prices of 50 percent off or more.)
Hours and Staffing
Sixty percent of respondents were open at least part of the day on Christmas Eve and 35 percent were open all day. Ninety-eight percent were closed on Christmas Day. Fifty-six percent were open part of the day on New Year’s Eve Day and 39 percent were open all day. Ninety-five percent were closed on New Year’s Day.

Source: SAF 2015 Holiday Sales and 2016 Valentine’s Intentions Survey. Emailed Jan. 4. 8.7 percent response rate.
Forty-five percent of respondents did not hire additional staff and 18 percent brought on only one person; 15 percent hired two. Ten percent hired three and about 9 percent brought in a team of four to six.
Poinsettia Sales Trends
Roughly 43 percent of all respondents said 2015 poinsettia sales were flat, compared to 2014. Nearly 40 percent said they were down and 16 percent said they were up. (About 1 percent reported not selling the popular Christmas plant.)
Most respondents who saw an increase in poinsettia sales, 37 percent, said the increase was between 1 and 10 percent. Among those who saw a drop, about 40 percent said the decline was between 1 and 10 percent. Almost 90 percent of respondents said at least 21 percent of poinsettias sold were traditional red plants.
When respondents were asked to consider a five-year trend of poinsettia sales, 43 percent said sales have been decreasing and about 30 percent said they’ve been flat. About 15 percent called them “irregular/fluctuating” and 7 percent said they’ve seen growth. (Five percent said they weren’t sure how sales had been trending.)


